Vis-By-Sketching
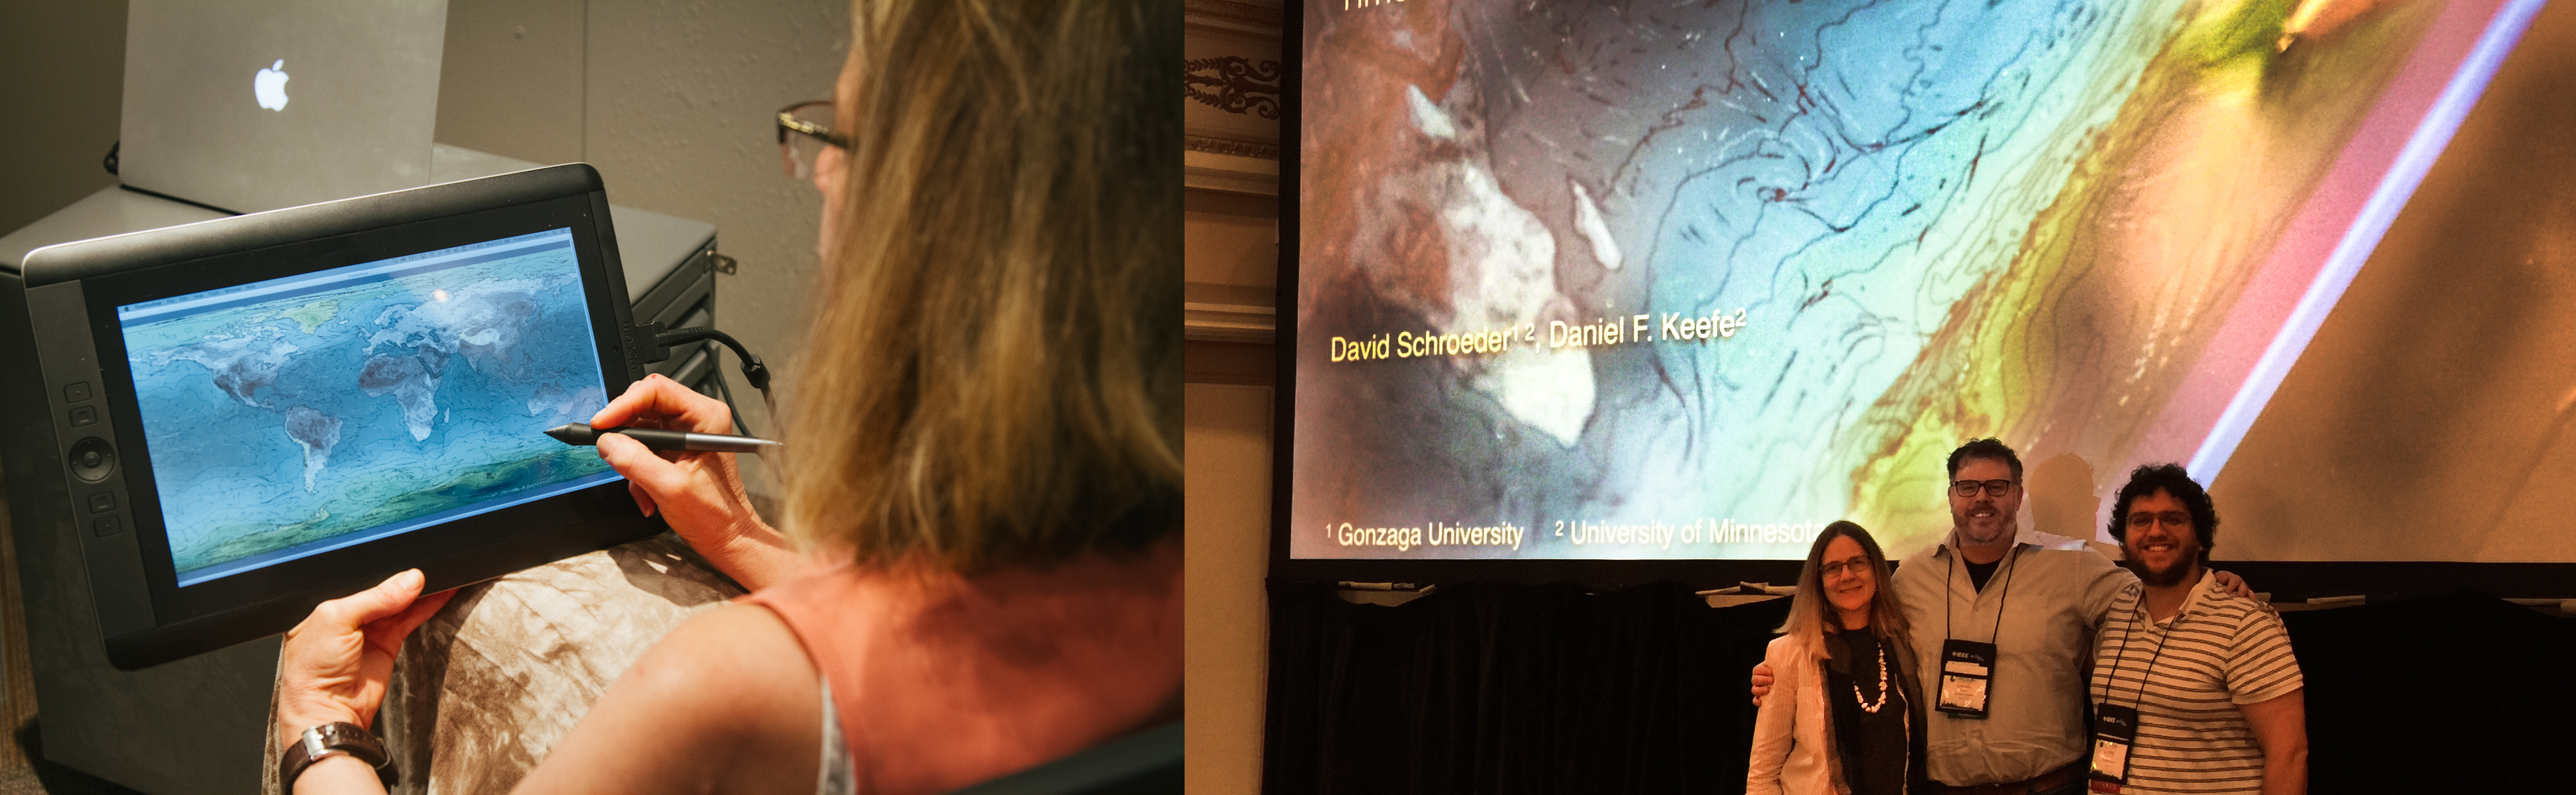
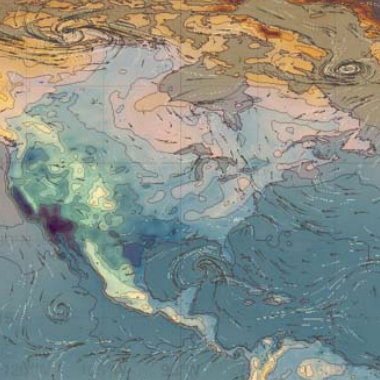
Visualization-by-Sketching is a direct-manipulation user interface for designing new data visualizations created in 2016. The goals were twofold: First, make the process of creating real, animated, data-driven visualizations of complex information more accessible to artists, graphic designers, and other visual experts with traditional, non-technical training. Second, support and enhance the role of human creativity in visualization design, enabling visual experimentation and workflows similar to what is possible with traditional artistic media. The approach was to conceive of visualization design as a combination of processes that are already closely linked with visual creativity: sketching, digital painting, image editing, and reacting to exemplars. Rather than studying and tweaking low-level algorithms and their parameters, designers create new visualizations by painting directly on top of a digital data canvas, sketching data glyphs, and arranging and blending together multiple layers of animated 2D graphics.
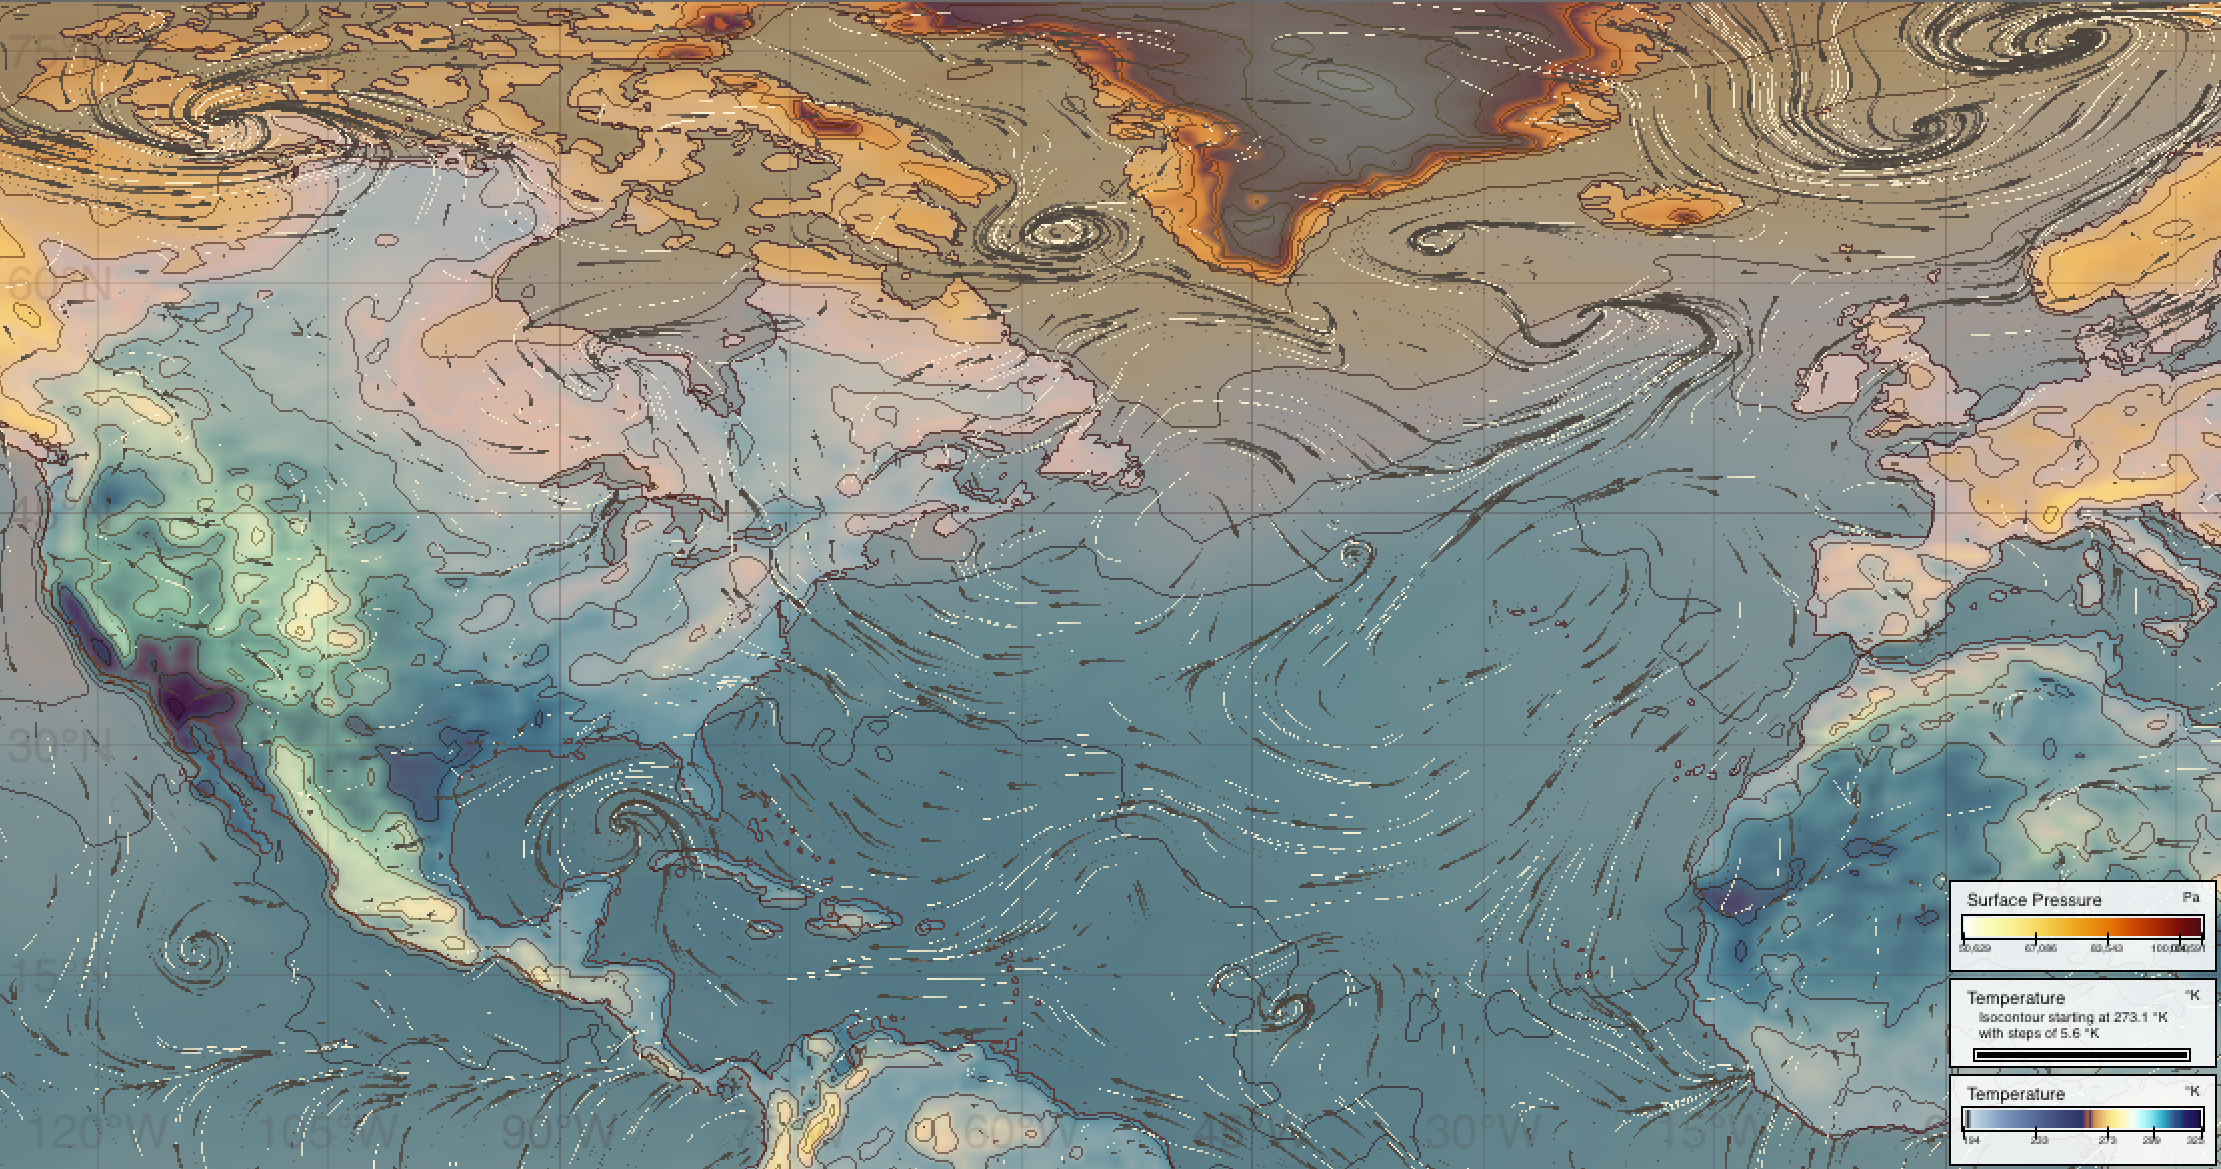
This required new algorithms and techniques to interpret painterly user input relative to data “under” the canvas, balance artistic freedom with the need to produce accurate data visualizations, and interactively explore large (e.g., terabyte-sized) multivariate datasets. Results demonstrated that a variety of multivariate data visualization techniques can be rapidly recreated using the interface. More importantly, results and feedback from artists support the potential for interfaces in this style to attract new, creative users to the challenging task of designing more effective data visualizations and to help these users stay “in the creative zone” as they work.
Publications
- @ARTICLE{7185456,
- author={Schroeder, David and Keefe, Daniel F.},
- journal={IEEE Transactions on Visualization and Computer Graphics},
- title={Visualization-by-Sketching: An Artist's Interface for Creating Multivariate Time-Varying Data Visualizations},
- year={2016},
- volume={22},
- number={1},
- pages={877-885},
- doi={10.1109/TVCG.2015.2467153}}
(2016).IEEE Transactions on Visualization and Computer Graphics vol. 22 no. 1 (877-885)
(cite)
Sculpting Visualizations © 2021