Domain Science Collaborations
Antarctic Water Mass
Modeling
Antarctic Water Mass Modeling
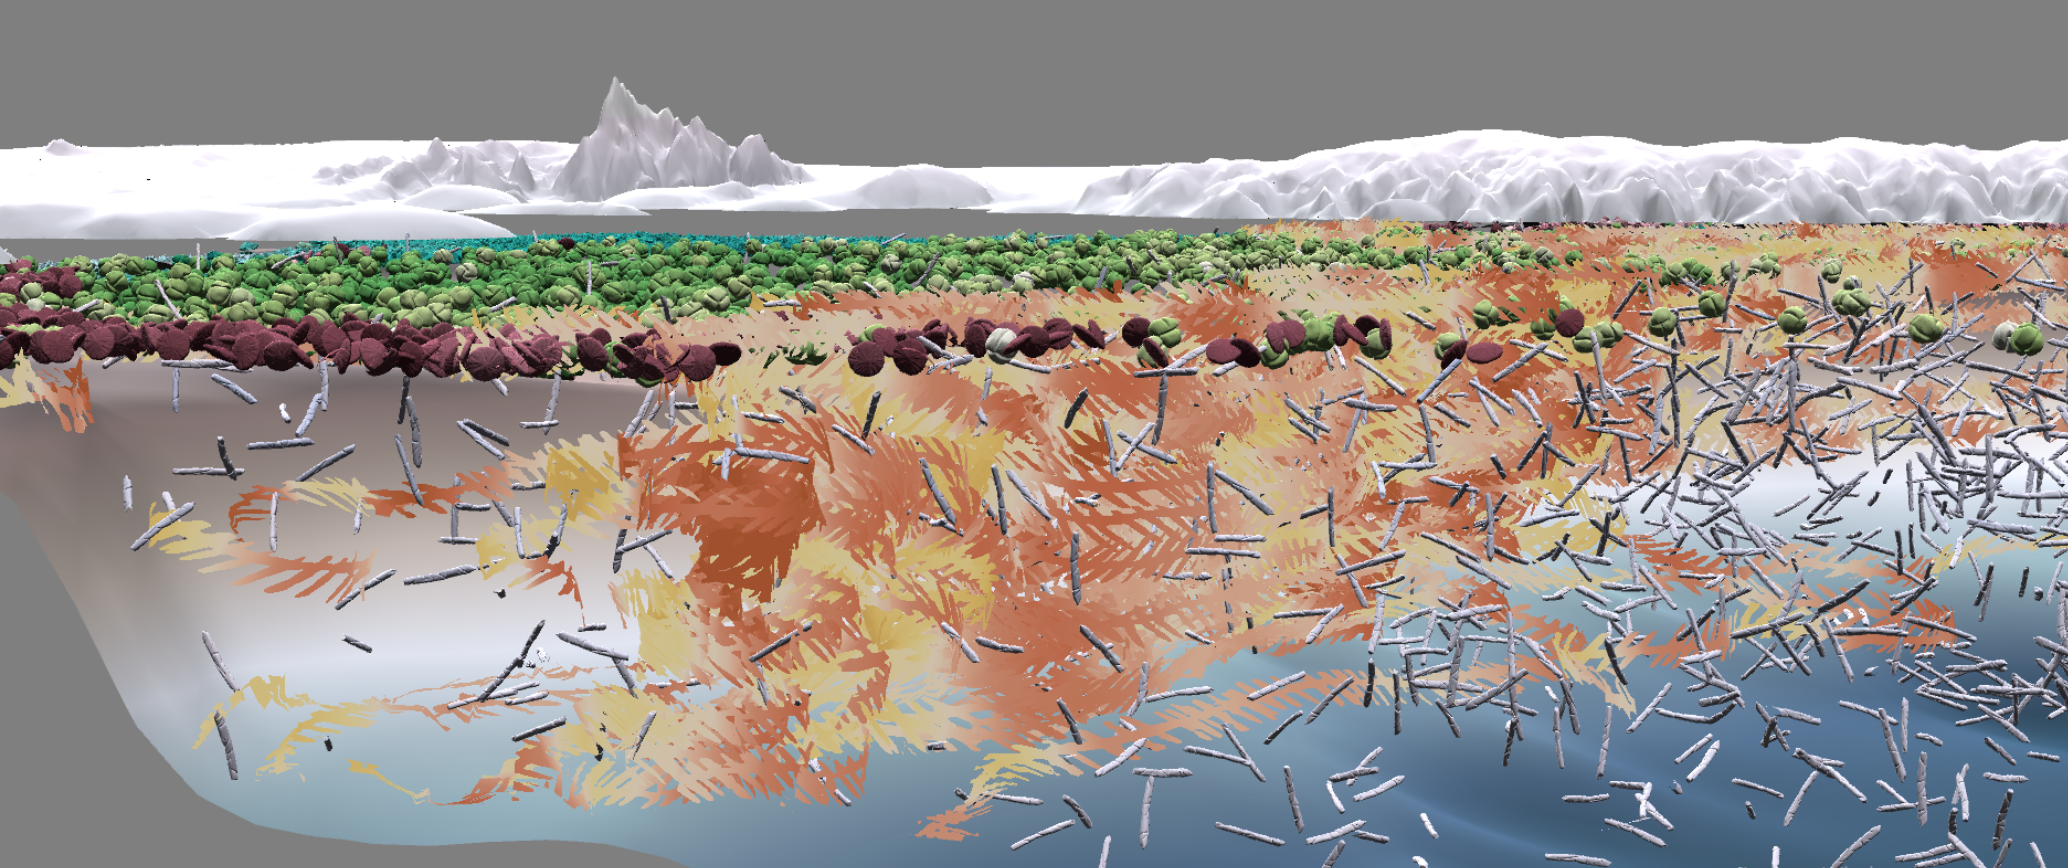
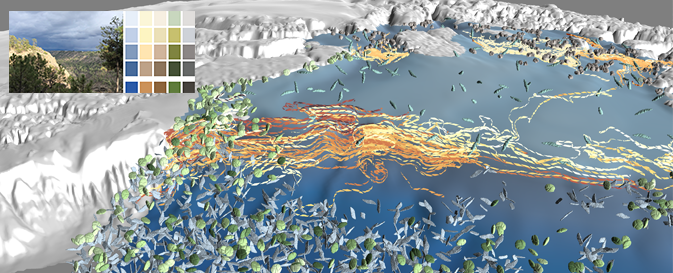
As rapid climate change begins to affect the Earth’s polar regions, scientists are studying the intricacies of ocean, atmosphere, and polar ice to understand how increasing temperatures will affect sealevel rise and coastal communities in the coming century. One area of particular interest for a team at Los Alamos National Laboratory (LANL) is Antarctica’s Filchner-Ronne Ice Shelf (Figure 1). Antarctica, a continent larger than the USA and Mexico combined, is covered by an average 2-km-thick ice sheet that, if completely melted, would contribute 60 m of sea-level rise. That would take thousands of years, but 1–2 m of potential sea-level rise in this century depends on the dynamics of floating ice shelves like the Filchner-Ronne. Ice shelves are the product of accumulated snowfall pushing off the continent and contribute to sea-level rise with accelerated melting (in contrast, sea ice freezes and melts seasonally at the ocean’s surface and does not affect sea level).
Antarctic Water Masses and Ice Shelves: Visualizing the Physics from Francesca Samsel on Vimeo.
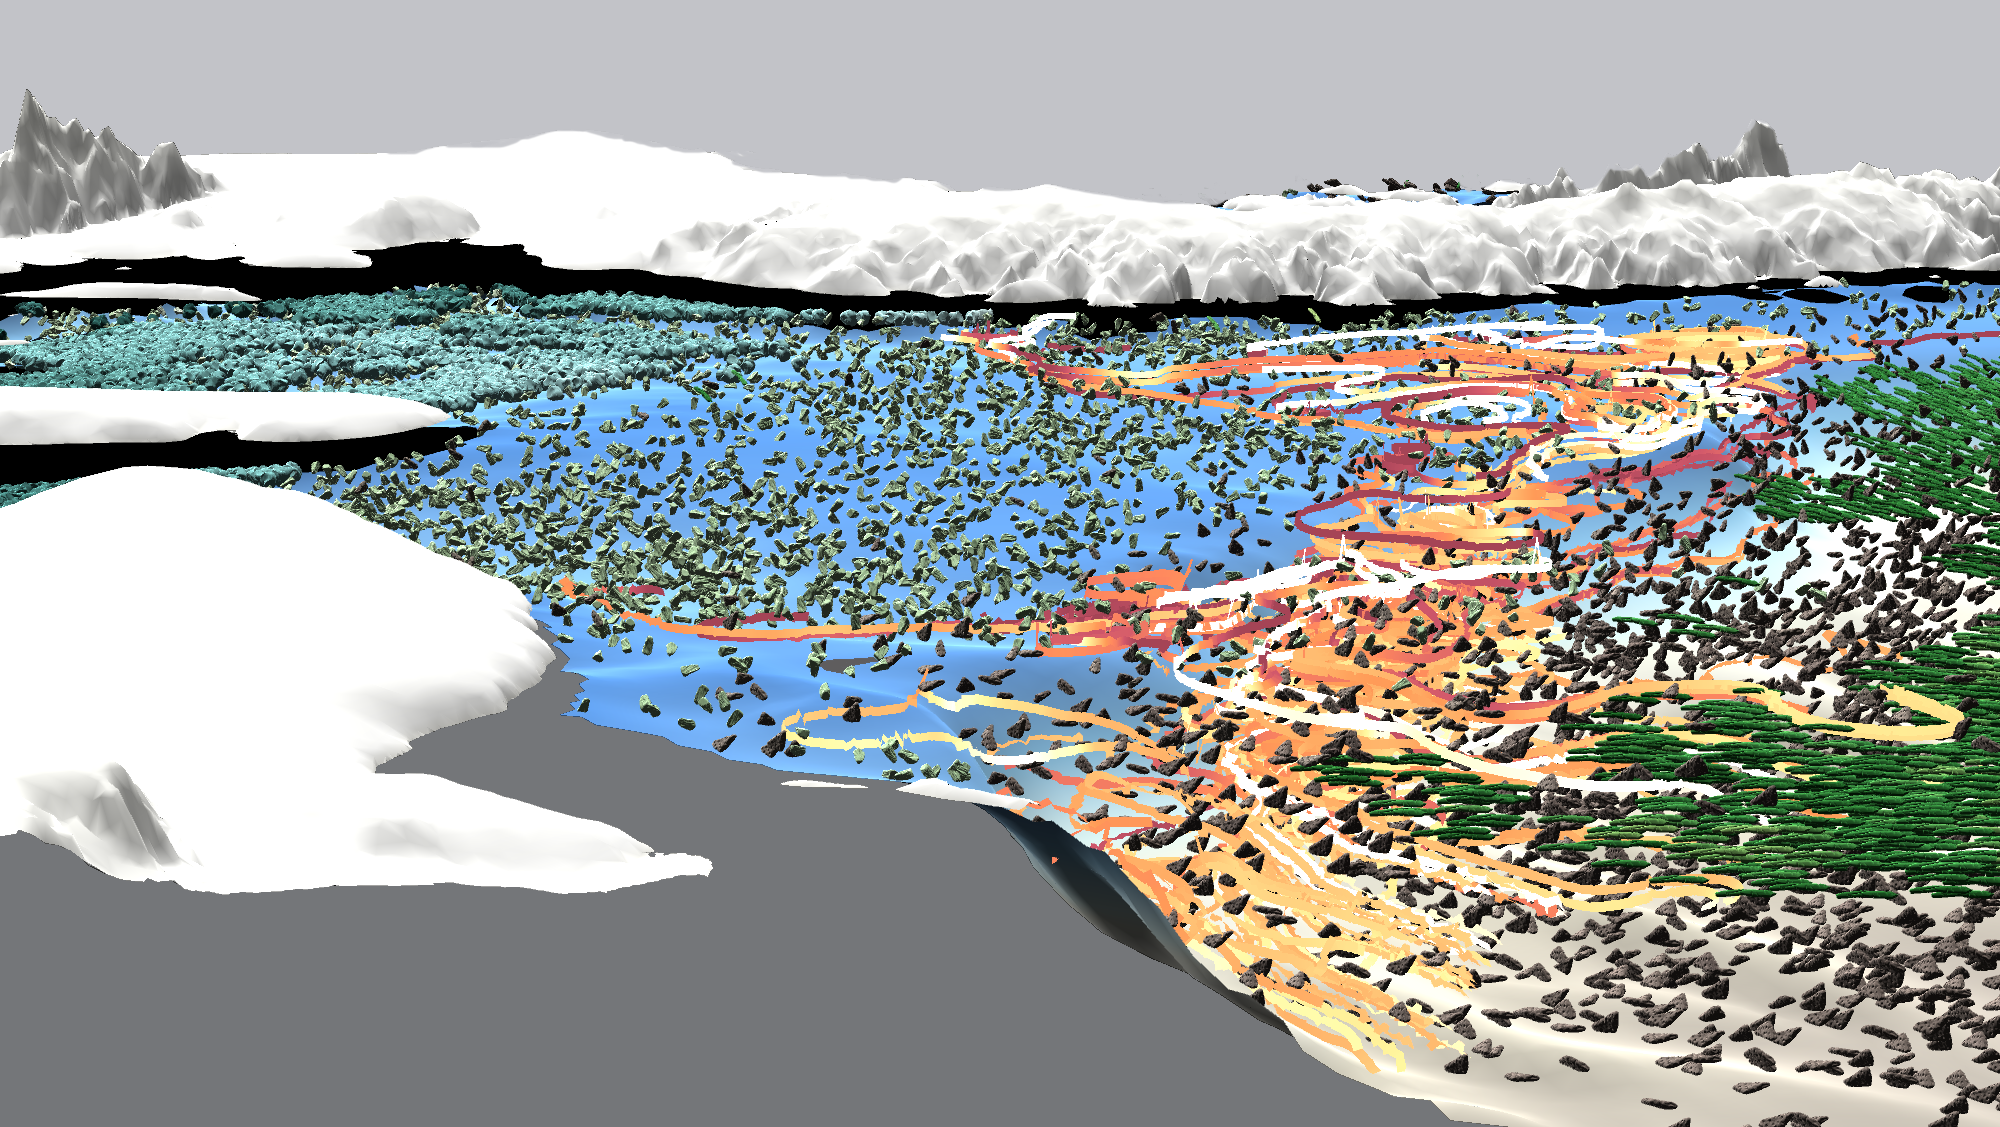
Scientists believe that warming ocean waters beneath the ice shelves will increase their melt rates, which may in turn speed up the ice streams that feed the shelves. As polar currents circulate, they push water masses—a classification oceanographers use to separate ocean water into specific ranges of temperature and salinity—beneath the ice shelves, where they become difficult to track. Scientists must rely on models to understand the complex dynamics at play, as real-world observations only come through robotic submersibles or probes drilled through the ice. This creates a difficult visualization challenge in terms of providing clarity, detail, and data interrogation capability in a complex, three-dimensional space. In order to accomplish this, we gathered an interdisciplinary team of expert ocean modelers, computer scientists, visualization professionals, and an artist, who tackled these modeling and design challenges in a two-step process: a data reduction phase, in which the specific requirements of the science drive the transformation of the raw data to higher level representations, and a design phase, in which the use of artistic color theory introduces clarity within the complex multivariate imagery.
SC21_Polynyas.mp4 from Francesca Samsel on Vimeo.
Publications
Sculpting Visualizations © 2021