Artifact-Based Rendering
Artifact-Based Rendering (ABR) is a framework that includes tools and processes that enable digital visualizations to incorporate physical media. Created with artists and designers in mind, ABR is a technical foundation and the input channel for Sculpting Visualization’s project to enrich the visual vocabulary of scientific visualization through hand-crafted or naturally occurring objects. Read the full paper
Sculpting Visualizations - AGU 2020 from Francesca Samsel on Vimeo.
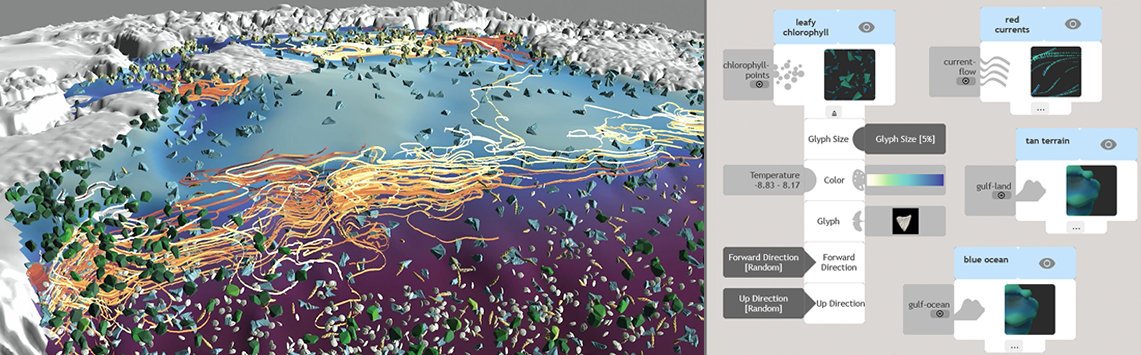
ABR Interface
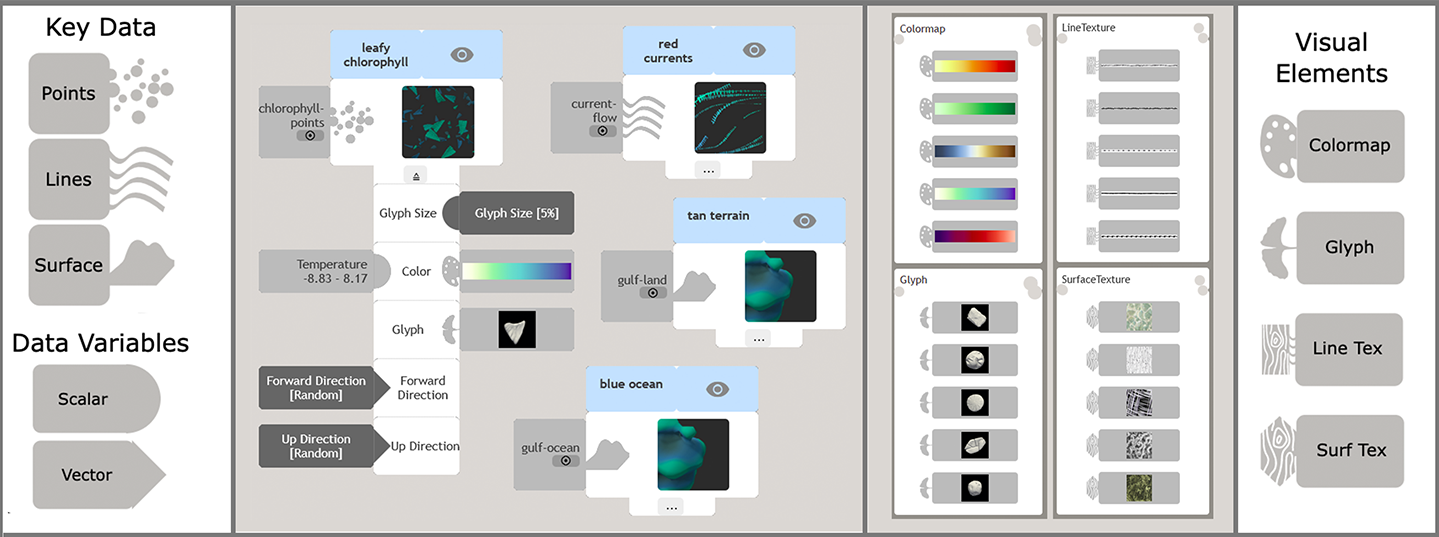
Artifact-Based Rendering is grounded in metaphors of printmaking, connecting our work in complex graphics processes with the practices of the artistic community. ABR layers glyphs, lines, and surfaces with color and shape the way a printmaker might approach image-making in their studio.
The user interface has five primary workable components:
- Key Data: geometric representations of your data (points, lines, surfaces), loaded from VTK unstructured grid files, each piece of key data has associated scalar & vector variables
- Data Impressions: your “layers” of data in the visualization. Apply variables and visual elements to each data impression, and watch as they are composed in real time in your visualization.
- Data Palette: the panel on the left-hand side which displays data impressions and loaded variables for your data.
- Composition Panel: the central window into which data impressions are dragged. Each set of data impressions + colormaps, glyphs, streamlines, etc. is called a “plate,” sticking with the printmaking metaphors. Use this panel like you would in Photoshop, adding visual elements as you see fit. More information on this can be found further along in this instructional guide.
- Design Palette: the panel on the right-hand side which displays all design options for the elements that comprise your visualization.
Expanded Visualization Vocabularies
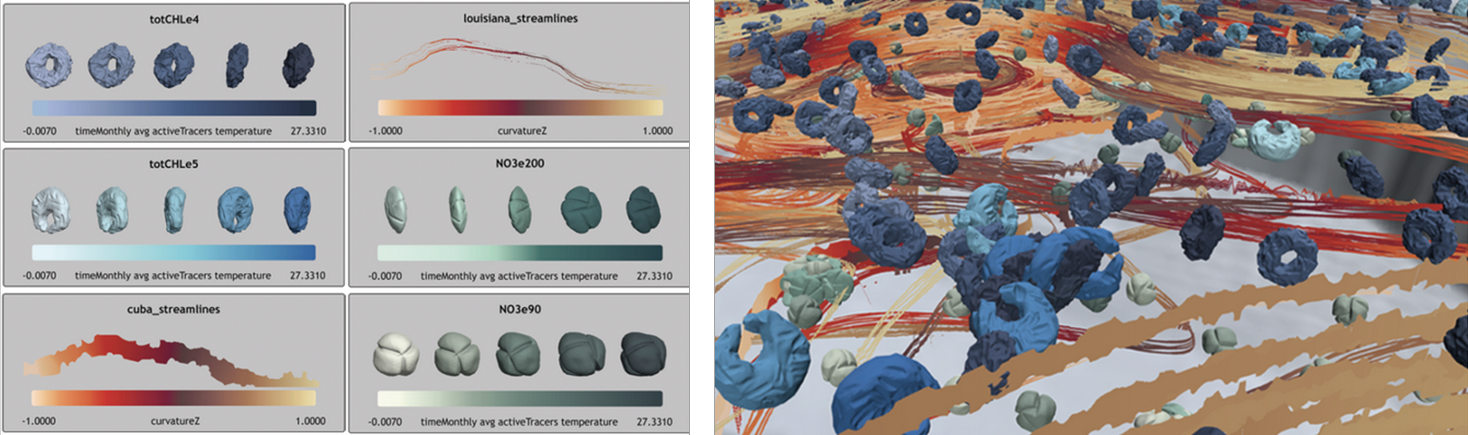
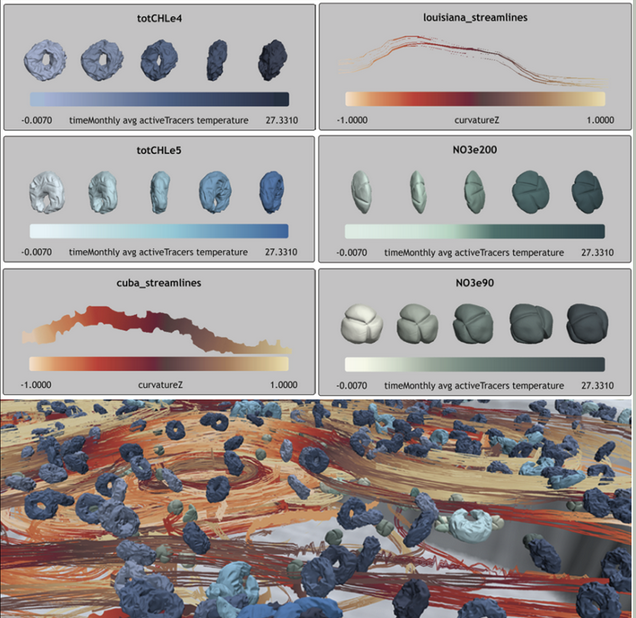
ABR enables artists and designers to leverage their practices in the visualization space. This capability includes expanding the visual vocabulary of scientific visualization—redefining the visual components used in data representations in a shift toward human- and nature-made glyphs, textures, lines and colors. This shift shortens the distance between data and the natural phenomena they represent and opens new possibilities for visually distinguishing and communicating intra-variate dynamics in complex visualizations.
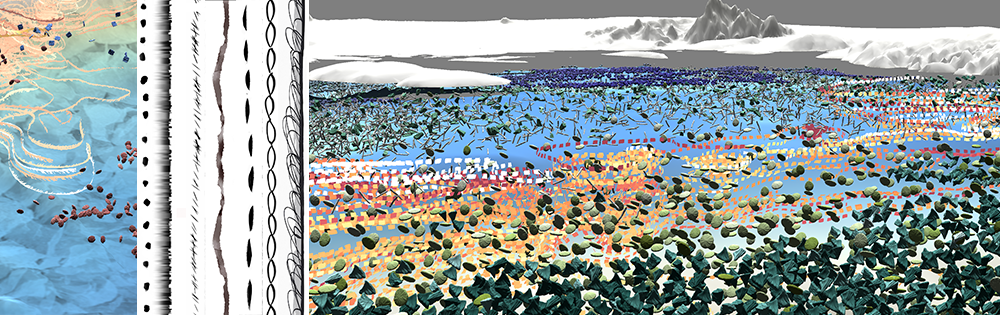
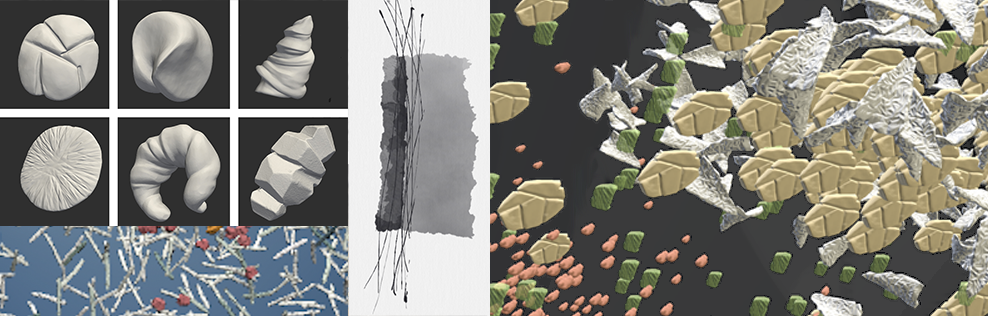
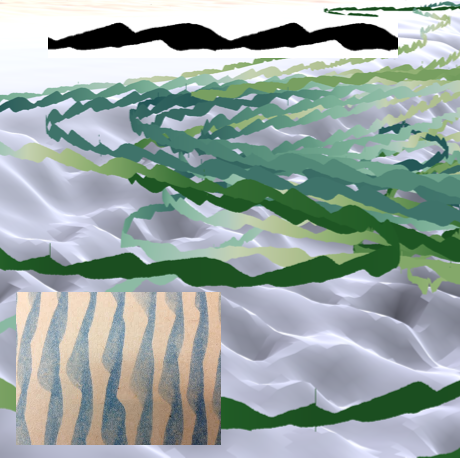
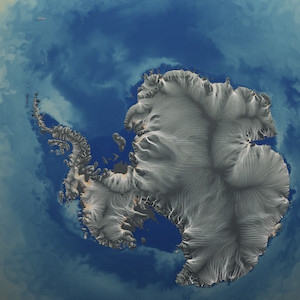
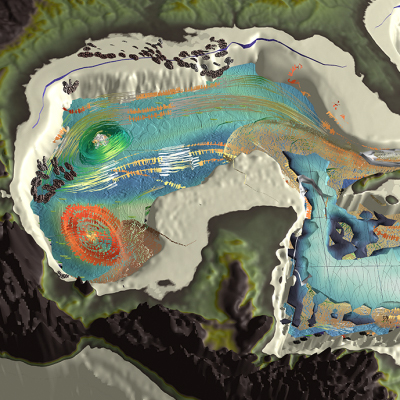
Hand-drawn and painted lines and line-components in the center of this image are applied to visualized Antarctic data, generated as data-mapped streamlines in ABR. The final visualizations can be seen on the far left and right of the image above.
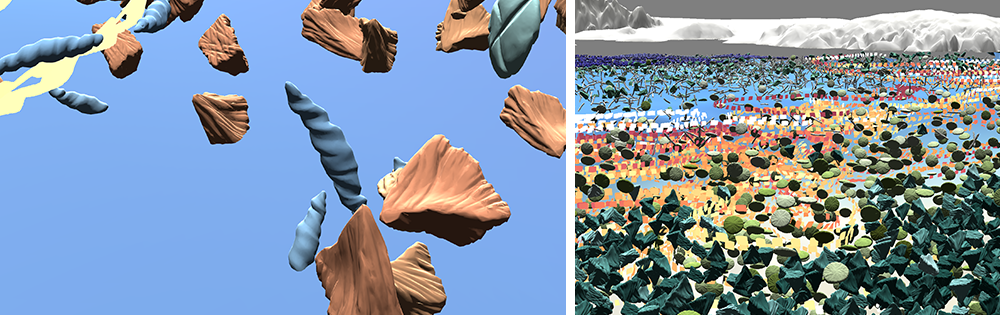
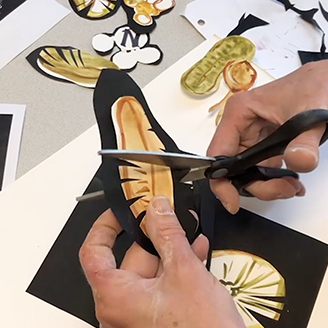
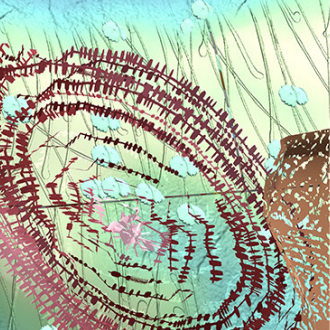
Here, hand-sculpted glyphs create a wide variety of both shape and texture (center), which can be imported as data-mapped objects into ABR and used in complex, multivariate visualizations, such as those shown in the left and right images above.
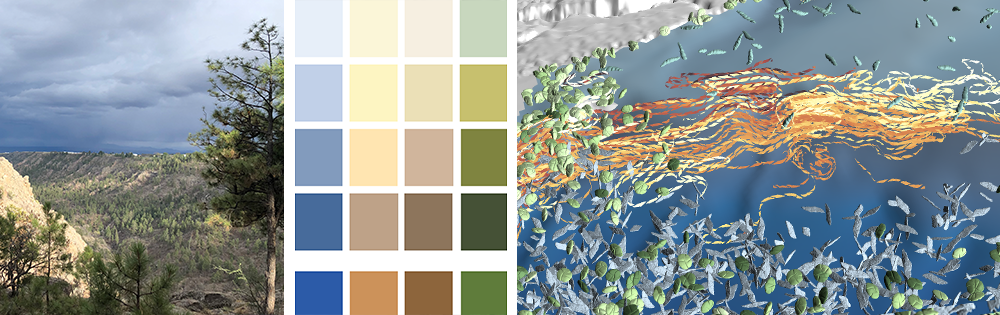
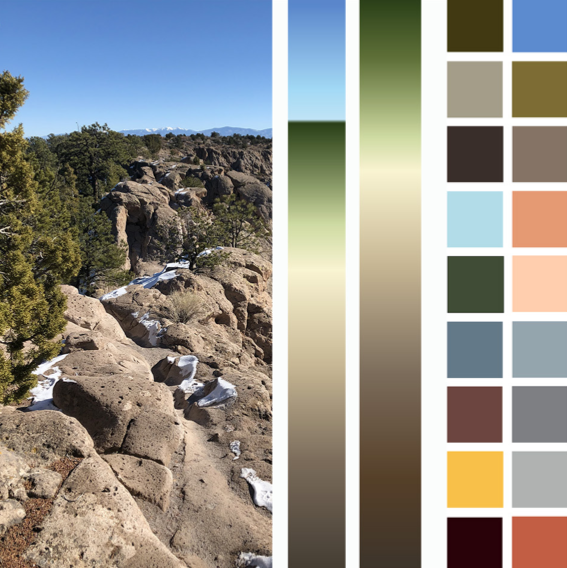
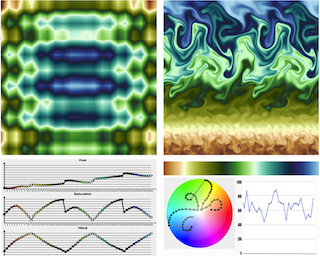
By drawing color from natural imagery using ColorLoom, we can more effectively connect environmental data with the physical phenomena it represents, creating Affective visualizations that are intuitive and easy to parse. Here, the leftmost image shows an iPhone photo taken of the New Mexico landscape. The central image shows a palette of colors taken directly from the New Mexico landscape image. The rightmost image shows a visualization of Southern Ocean data using these colors.
ABR Libraries
.png)
The ABR library catalogues glyphs, lines, colormaps, and textures created by Francesca Samsel, professional artist and co-PI of the Sculpting Vis Collaborative. Each of these assets is usable in the Artifact-Based Rendering program. Click here to access the online library of vis assets.
Applets
Infinite Line
.png)
Hand-drawn and painted lines and line-components used to generate data-mapped streamlines in ABR.
Infinite Line brings the physical artistic process into the visualization generation pipeline by allowing a user to sketch a line segment, upload an image of the sketch, and turn that sketch into a continuous, unbroken, patterned streamline. The output file can be dragged directly into ABR for immediate use.
Glyph Aligner
.png)
A wide variety of both shape and texture in hand-made objects, which are then imported into ABR and mapped to data
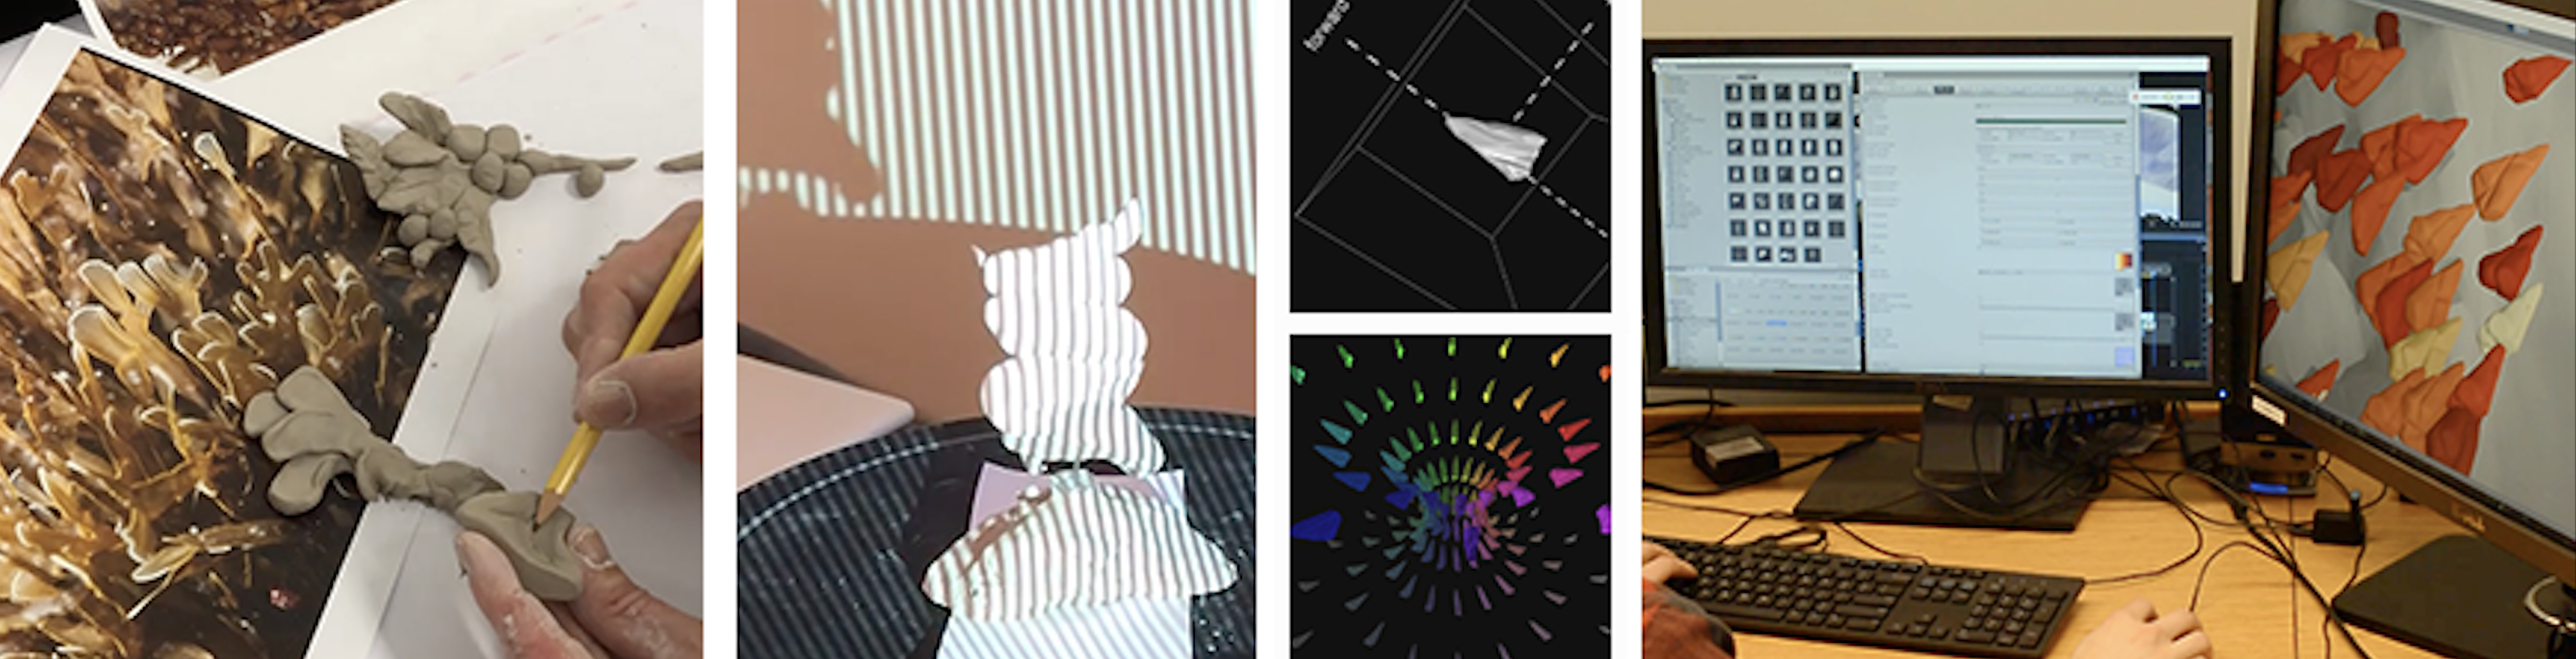
Glyph Aligner like Infinite Line, connects the physical artistic process with the digital. When an artist creates a three-dimensional object, such as a small clay sculpture, they can 3D scan this object and drag it into Glyph Aligner. Glyph Aligner allows users to give this 3D scan a directional quality. The output file can be dragged directly into ABR for immediate use as a glyph.
ColorLoom
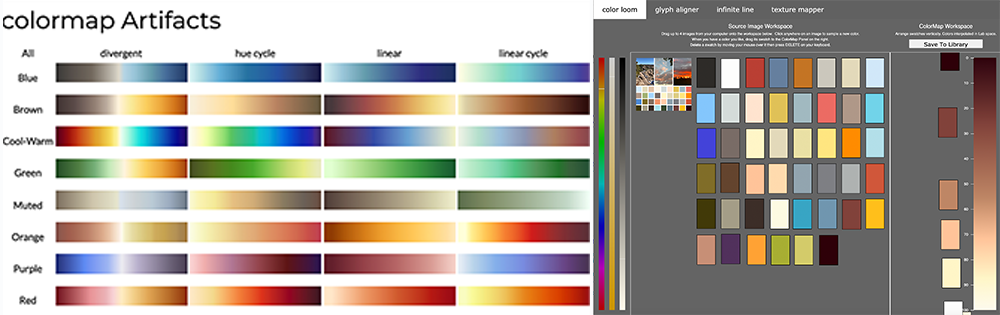
By drawing color from nature / natural imagery, using ColorLoom, we can more effectively connect environmental data with the physical phenomena it represents, creating Affective visualizations that are intuitive and easy to parse.
ColorLoom allows a user to generate custom colormaps with hues automatically pulled from imported images. This applet gives users looking to design a custom colormap a dynamic starting point, and allows them to pull hues from imagery directly related to the dataset they are visualizing.
Texture Mapper
.png)
Texture Mapper shortens the space between the texture of the physical and digital worlds. A user may simply take a photo of any surface and upload that photo to texture mapper. The program automatically extracts the texture of the photo and produces a file output that can be dragged directly into ABR for immediate use as a texture for data surfaces in a visualization.
Resources
Publications
- @article{SamselZellerAbramKeefe21,
- title={Affective Palettes For Scientific Visualization: Grounding Environmental Data In The Natural World},
- journal={not yet available, IEEE VisApp},
- author={Francesca Samsel, Stephanie Zeller, Daniel F. Keefe, and Greg Abram},
- year={2021}
- }
(2021).not yet available, IEEE VisApp
(cite)
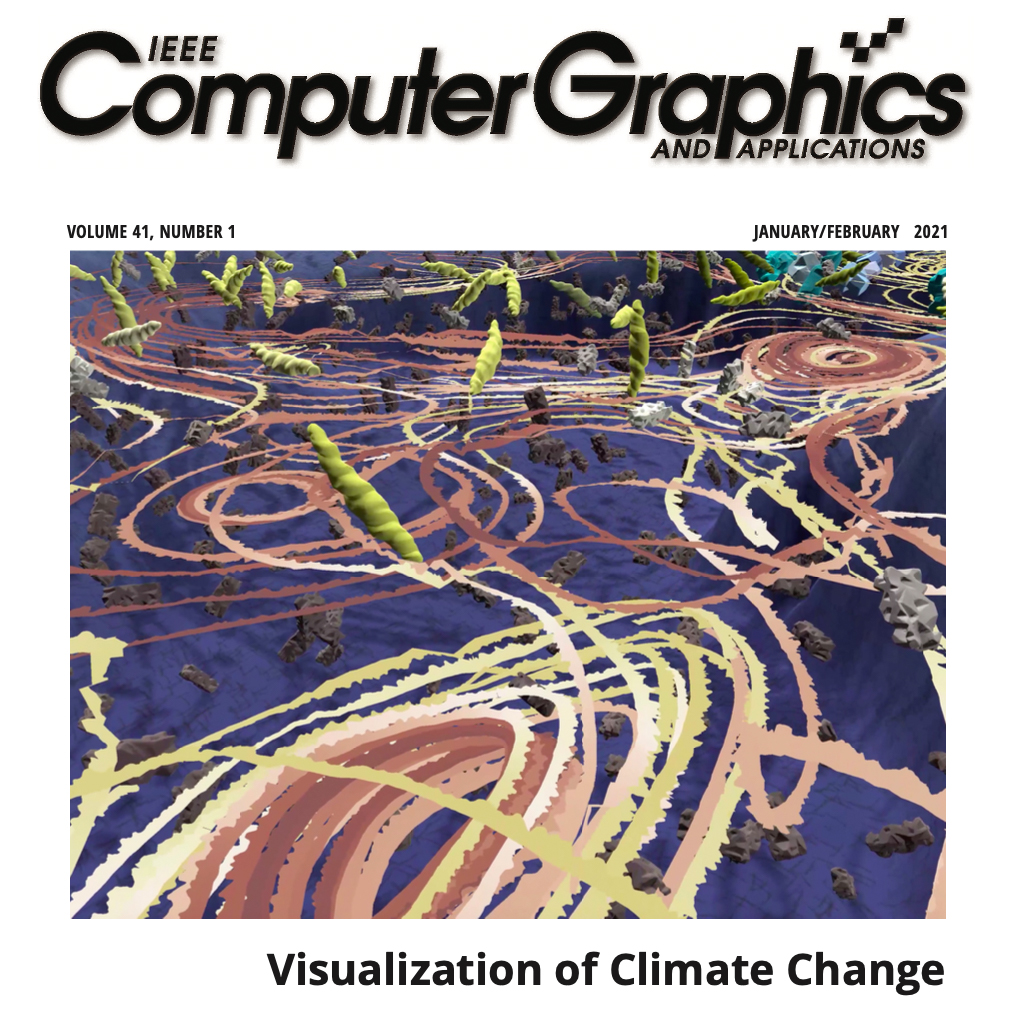
- @article{Abram_Samsel_Petersen_Asay-Davis_Comeau_Price_Potel_2021,
- title={Antarctic Water Masses and Ice Shelves: Visualizing the Physics},
- volume={41},
- url={https://ieeexplore.ieee.org/document/9325139/},
- DOI={10.1109/MCG.2020.3044228},
- number={1},
- journal={IEEE Computer Graphics and Applications},
- author={Abram, Greg and Samsel, Francesca and Petersen, Mark R. and Asay-Davis, Xylar and Comeau, Darin and Price, Stephen F. and Potel, Mike},
- year={2021},
- month={Jan},
- pages={35–41}
- }
(2021).IEEE Computer Graphics and Applications vol. 41 no. 1 (35–41)
(cite)
- @ARTICLE{9325135, author={Singh, Gary}, journal={IEEE Computer Graphics and Applications}, title={From Human Hands}, year={2021}, volume={41}, number={1}, pages={5-7}, doi={10.1109/MCG.2020.3043985}}
(2021).IEEE Computer Graphics and Applications vol. 41 no. 1 (5-7)
(cite)
- @inproceedings{10.1145/3311790.3396667,
- author = {Zeller, Stephanie and Samsel, Francesca and Nav\'{a}rtil, Paul},
- title = {Environmental Visualization: Moving Beyond the Rainbows},
- year = {2020},
- isbn = {9781450366892},
- publisher = {Association for Computing Machinery},
- address = {New York, NY, USA},
- url = {https://doi.org/10.1145/3311790.3396667},
- doi = {10.1145/3311790.3396667},
- abstract = {Pseudo-coloring is a well-established, fundamental tool for visualizing scientific
- data. As the size and density of data grows, increasingly more discriminatory power
- is required to extract optimum feature resolution. The environmental community, in
- particular, relies heavily on this technology to dissect and interpret a huge variety
- of visual data. These scientists often turn to traditional rainbow colormaps, despite
- their well-documented deficiencies in rendering dense detail. A popular default, the
- desaturated rainbow’s non-monotonically varying luminance range misrepresents data.
- Despite increasing overall feature resolution, this variance creates hue simultaneity
- and vibration, introducing false artifacts, hindering exploration of swaths of data
- and impeding analysis [13, 21, 26]. Drawing on artistic color theory, we hypothesized
- the desaturated rainbow could be improved by increasing luminance ranges, decreasing
- saturation, and employing hue-cycling to boost discriminatory power. These adjusted
- maps exhibit algorithmically corroborated higher feature resolve, a primary objective
- of all scientists interviewed, without distorting data in discordant false coloring.
- Our studies indicate that our maps are preferred by these domain scientists, thereby
- providing a potential alternative for effective, human-centric colormapping.},
- booktitle = {Practice and Experience in Advanced Research Computing},
- pages = {321–326},
- numpages = {6},
- keywords = {design, visualization, color theory, colormaps},
- location = {Portland, OR, USA},
- series = {PEARC '20}
- }
(2020).(321–326)
(cite)
- @inproceedings{SamselKeefHermanZeller20,
- title={Poster: Human Fingerprints and Artistic Vocabulary; Rendering Data, Creating Engagement, Connection and Context to Earth System Models},
- author={Francesca Samsel, Daniel Keefe, Bridger Herman, Greg Abram},
- journal={Poster at AGU'20},
- year={2020}
- }
(2020).Poster at AGU'20
(cite)
- @INPROCEEDINGS{9308002, author={Herman, Bridger and Samsel, Francesca and Bares, Annie and Johnson, Seth and Abram, Greg and Keefe, Daniel F.}, booktitle={2020 IEEE VIS Arts Program (VISAP)}, title={Printmaking, Puzzles, and Studio Closets: Using Artistic Metaphors to Reimagine the User Interface for Designing Immersive Visualizations}, year={2020}, volume={}, number={}, pages={19-28}, doi={10.1109/VISAP51628.2020.00009}}
(2020).vol. no. (19-28)
(cite)

- @phdthesis{sethdiss,
- author={Johnson,Seth A.},
- year={2020},
- title={Palpable Visualizations: Techniques for Creatively Designing Discernible and Accessible Visualizations Grounded in the Physical World},
- journal={ProQuest Dissertations and Theses},
- pages={217},
- note={Copyright - Database copyright ProQuest LLC; ProQuest does not claim copyright in the individual underlying works; Last updated - 2021-05-22},
- abstract={This dissertation investigates techniques to leverage creative processes like sketching, sculpting, and design iteration to improve the discernibility and accessibility of immersive volumetric data visualizations. Discernible visualizations support a viewer's ability to make sense of complexities such as multi-dimensional climate or engineering simulation data. Accessible data visualization both supports the contribution of previously under-utilized design expertise (i.e. artist-accessible visualization design), and subsequently provides access for a broad audience to engage with data through an emphasis on human connection and support for a wide range of displays. Such visualizations aim to provide a palpable, data-driven experience for scientists, artists, and the public. Three early works are presented as a rationale for investigating Palpable Visualizations. Bento Box, an immersive visualization system for comparing multiple time-varying volumetric simulation ensemble instances, demonstrates a current state-of-the-art for scientific data visualization. Weather Report, an interactive site-specific artwork visualizing six decades of weather data, takes an in-depth look at what can be accomplished when designing data-driven experiences in close collaboration with professional designers. And Lift-Off, a VR-based modeling program designed for artists, shows how creative sketching in both the physical and virtual worlds can result in a more accessible environment for both scientific and design-oriented tasks. Based on observations from these three prior works, we present Artifact-Based Rendering (ABR), a framework of algorithms and processes that makes it possible to produce real, data-driven 3D scientific visualizations with a visual language derived entirely from colors, lines, textures, and forms created using traditional physical media or found in nature. ABR addresses three current needs: (i) designing better visualizations by making it accessible for non-programmers to rapidly design and critique many alternative data-to-visual mappings; (ii) expanding the visual vocabulary used in scientific visualizations to enable discernment of increasingly complex multivariate data; (iii) bringing a more engaging, natural, and human-relatable handcrafted aesthetic to data visualization to make the resulting data-driven images more accessible and discernible to the viewer. Finally, we support the accessibility of visualizations through a data streaming and remote rendering pipeline, culminating in demonstrations bridging live supercomputer simulation data with untethered affordable head-mounted AR/VR displays.},
- keywords={3D user interfaces; Virtual reality; Visualization; Computer science; 0984:Computer science},
- isbn={9798662501805},
- language={English},
- url={http://ezproxy.lib.utexas.edu/login?url=https://www.proquest.com/dissertations-theses/palpable-visualizations-techniques-creatively/docview/2436788603/se-2?accountid=7118},
- }
(2020).ProQuest Dissertations and Theses (217)
(cite)
- @inproceedings{SC21Antarctic,
- author = {J. Patchett, F. Samsel, K. Rigel, G. Abram, N. Woods, D. Lipsa, M. Hoffman, S. Price, M. Petersen, T. Zhang, X. Asay- Davis },
- title = {Scientific Visualization of Antarctica Ice Sheet and Southern Ocean Evolution},
- published = {Supercomputing Scientific Visualization and data Analytics Competition, SC 2020 },
- year = {2020},
- }
(2020).
(cite)
- @inproceedings{weissman2020poster,
- title={Poster: Automatic Generation of Data Legends for 3D Multi-Variate Artist Driven Visualizations},
- author={Weissman, Claire and Herman, Bridger and Zeller, Stephanie and Samsel, Francesca and Keefe, Daniel F},
- booktitle={IEEE Visualization},
- year={2020}
- }
(2020).
(cite)
- @ARTICLE{Johnson-2019-ABR,
- author={Seth Johnson and Francesca Samsel and Gregory Abram and Daniel Olson and Andrew J. Solis and Bridger Herman and Phillip J. Wolfram and Christophe Lenglet and Daniel F. Keefe},
- title={Artifact-Based Rendering: Harnessing Natural and Traditional Visual Media for More Expressive and Engaging 3D Visualizations},
- journal={IEEE Transactions on Visualization and Computer Graphics},
- year={2019},
- url={https://arxiv.org/pdf/1907.13178.pdf},
- doi={10.1109/TVCG.2019.2934260},
- }
(2019).IEEE Transactions on Visualization and Computer Graphics
(cite)

- @INPROCEEDINGS{9046053,
- author={Samsel, Francesca and Bartram, Lyn and Bares, Annie},
- journal={2018 IEEE VIS Arts Program (VISAP)},
- title={Art, Affect and Color: Creating Engaging Expressive Scientific Visualization},
- year={2018}, pages={1-9}, doi={10.1109/VISAP45312.2018.9046053}}
(2018).2018 IEEE VIS Arts Program (VISAP) (1-9)
(cite)
- @INPROCEEDINGS{Samsel-2019-Enriching,
- author={Francesca Samsel and Annie Bares and Seth Johnson and Daniel F. Keefe},
- year={2019},
- title={Enriching Vocabulary via the Human Hand},
- howpublished={IEEE VIS Arts Program 2019},
- paperlink={https://www.sculpting-vis.org/wp-content/uploads/2020/01/VISAP_2019-FS-5-19v2-copy.pdf},
- abstract={As scientific data grow larger and more complex, an equally rich visual vocabulary is needed to fully articulate its insights. We present a series of images that are made possible by a recent technical development “Artifact-Based Rendering,” a component of our broader effort to create a methodology for scientific visualization that draws on principles of art and design.},
- projects={sculpting-vis}
- }
(2019).
(cite)
- @inproceedings{inproceedings,
- author = {Bares, Annie and Zeller, Stephanie and Jackson, Cullen and Keefe, Daniel and Samsel, Francesca},
- year = {2020},
- month = {10},
- pages = {29-37},
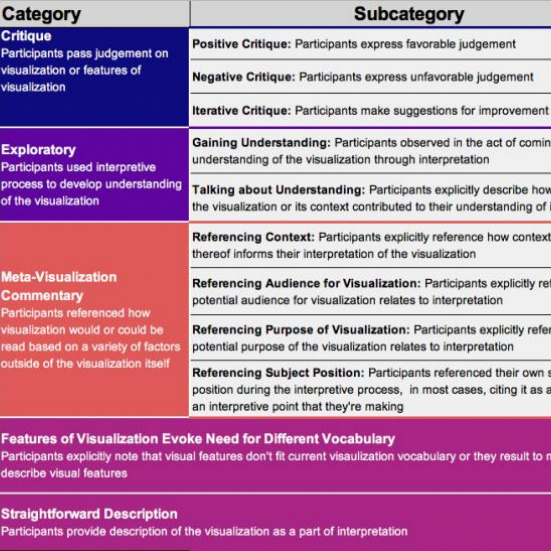
- title = {Using Close Reading as a Method for Evaluating Visualizations},
- doi = {10.1109/BELIV51497.2020.00011}
- }
(2020).(29-37)
(cite)
Sculpting Visualizations © 2021